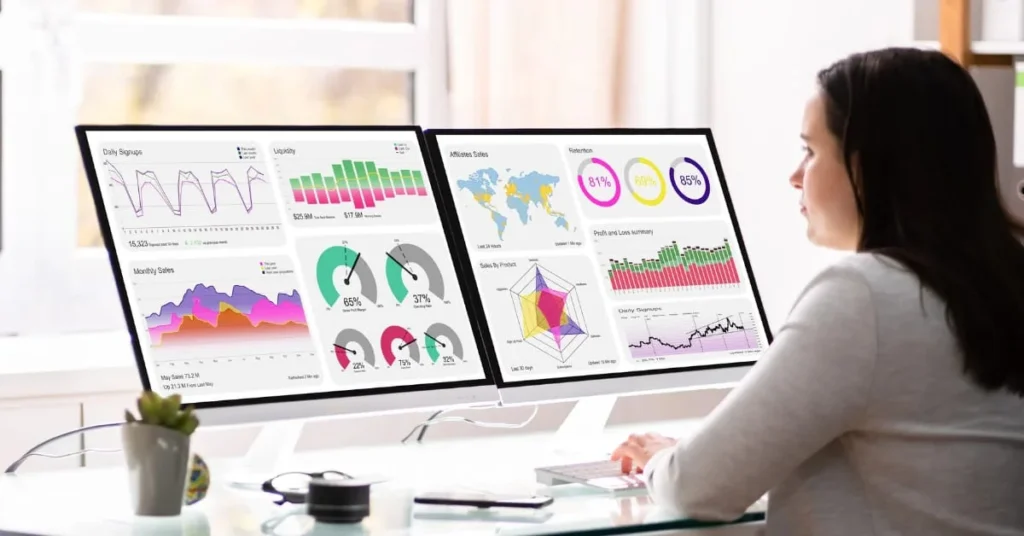
Ever felt swamped by endless rows of data? You’re not alone. In today’s marketing world, data is everywhere, and it can feel overwhelming. But what if I told you there’s a way to turn those daunting spreadsheets into something you can actually use? That’s where data visualization comes in. It’s all about transforming raw numbers into compelling visuals that make sense of the chaos, helping you make smarter decisions. In this post, we’ll explore the Top Data Visualization Tools that can help you succeed as a marketer. Let’s dive in!
The Importance of Data Visualization in Marketing
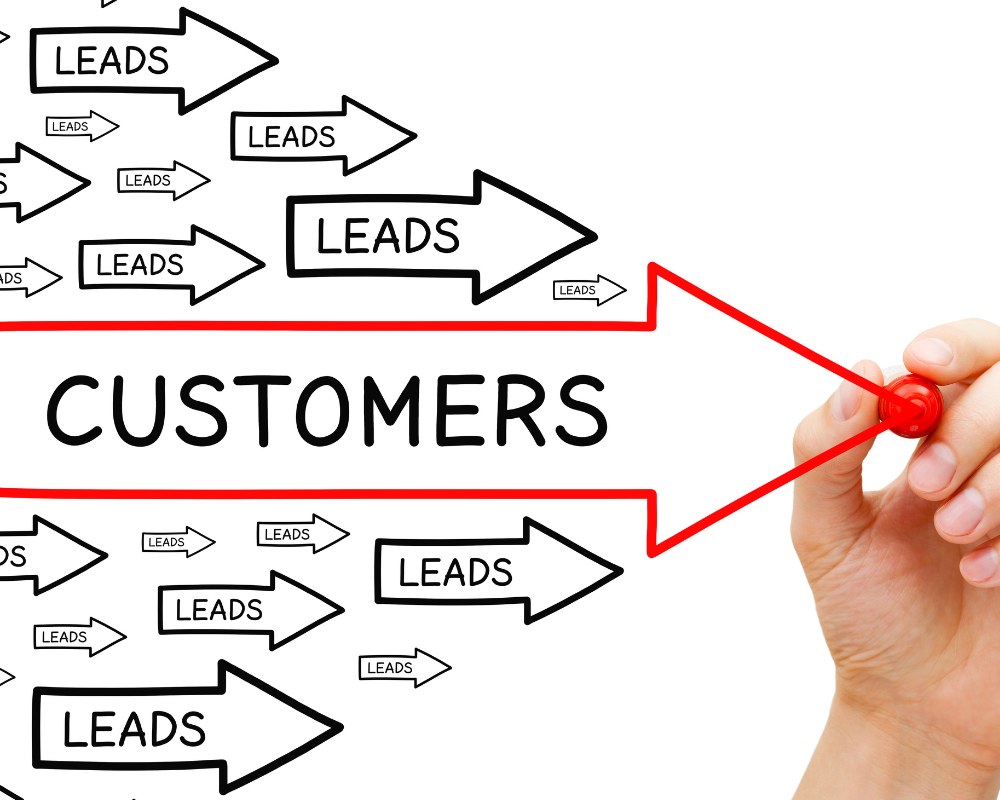
In marketing, data is your best friend—if you know how to use it. Data visualization turns your data into charts, graphs, and dashboards that tell a story. Instead of sifting through endless numbers, you get a clear picture of what’s happening with your campaigns, customers, and performance metrics. It’s like having a map that guides you through the terrain of your marketing efforts, showing you exactly where to go next.
When you visualize data, patterns emerge. You can quickly spot what’s working and what’s not. This helps you make informed decisions that can boost your campaigns, improve your ROI, and communicate insights effectively to your team or clients. In short, data visualization makes marketing data accessible and actionable.
Top Data Visualization Tools for Marketers
When it comes to choosing a data visualization tool, the options can seem endless. But don’t worry—we’ve narrowed it down to the top five tools that marketers love. Each of these tools offers something unique, so you can find the perfect fit for your needs.

1. Tableau
Features: Tableau is known for its powerful analytics and user-friendly interface. It allows you to create detailed visualizations with just a few clicks. Plus, it integrates well with many data sources, making it versatile for any marketing team.
Pros:
- Advanced analytics capabilities
- Easy to use, even for beginners
- Extensive integration options
Cons:
- Can be expensive for smaller teams
- Steeper learning curve for advanced features
2. Power BI
Features: If you’re already using Microsoft products, Power BI might be your best bet. It seamlessly integrates with Excel and other Microsoft tools, making it easy to import and analyze data in real-time.
Pros:
- Strong integration with Microsoft ecosystem
- Real-time analytics and dashboard updates
- Cost-effective for small to medium businesses
Cons:
- Interface can be less intuitive for non-Microsoft users
- Limited customization options compared to Tableau
3. Google Data Studio
Features: Google Data Studio is a free tool that’s perfect for marketers on a budget. It allows you to create customizable dashboards and reports, especially if you’re already using Google Analytics or Google Ads.
Pros:
- Free to use
- Easy integration with Google products
- Highly customizable
Cons:
- Limited functionality compared to paid tools
- Requires Google account for full features
4. Looker
Features: Looker is a powerful tool for teams that need strong data governance and embedded analytics. It’s ideal for companies that need to maintain strict control over their data while providing accessible visualizations to their team.
Pros:
- Strong data governance features
- Advanced embedded analytics
- Highly scalable for growing businesses
Cons:
- Higher cost, suitable for larger enterprises
- Requires technical expertise for setup
5. Domo
Features: Domo is a cloud-based platform that’s all about collaboration. It offers advanced visualization options and allows teams to work together on data projects in real-time, making it ideal for dynamic marketing teams.
Pros:
- Cloud-based for easy access anywhere
- Real-time collaboration features
- Advanced visualization options
Cons:
- Pricing can be high for small businesses
- Some users may find it complex to set up
How to Choose the Right Data Visualization Tool
With so many great tools available, how do you pick the right one for your marketing needs? Here are some key factors to consider:

1. Budget
Your budget will likely play a big role in your decision. Tools like Google Data Studio are free, making them ideal for smaller teams or those just starting out. On the other hand, if you’re ready to invest in a more robust solution, Tableau or Looker might be worth the cost due to their advanced features and scalability.
2. Integration
Consider how well the tool integrates with your existing marketing platforms. If you’re heavily invested in the Microsoft ecosystem, Power BI’s seamless integration with Excel and Azure will save you time and effort. Meanwhile, Google Data Studio is a natural fit for those already using Google Analytics or Google Ads.
3. Ease of Use
Not everyone on your team may be a data wizard, so ease of use is crucial. Tools like Tableau and Power BI offer user-friendly interfaces that make it easy to create stunning visuals, even if you’re not a tech expert. Look for tools that offer drag-and-drop features or pre-built templates to simplify the process.
4. Scalability
As your business grows, your data needs will likely grow too. Choosing a tool that can scale with your business is essential. Looker and Domo are particularly strong in this area, offering features that can handle large datasets and complex visualizations as your marketing efforts expand.
5. Specific Marketing Needs
Finally, think about your specific needs. Are you looking for real-time data updates? Power BI and Domo excel in this area. Do you need strong data governance? Looker might be your best bet. Identify the features that are most important to your team and choose a tool that meets those needs.
Use Cases of Data Visualization in Marketing
To help you see these tools in action, let’s explore some real-world examples of how marketers are using data visualization to drive success.
1. Enhancing Campaign Performance with Tableau
A digital marketing agency used Tableau to track the performance of multiple campaigns across different channels. By visualizing data from social media, email marketing, and PPC ads, they could quickly identify which campaigns were driving the most engagement. This allowed them to optimize their efforts in real-time, reallocating budgets to the highest-performing channels. The result? A 30% increase in ROI within three months.
2. Real-Time Data Monitoring with Power BI
A retail brand needed to keep a close eye on sales data across their online and physical stores. With Power BI, they set up real-time dashboards that pulled data from their CRM and inventory systems. This allowed their marketing team to react quickly to changes in customer behavior, such as an unexpected drop in sales or a surge in demand for a particular product. By making data-driven adjustments to their promotions and stock levels, they maintained steady growth even during volatile periods.
3. Simplifying Reporting for Stakeholders with Google Data Studio
A small business owner wanted to keep her investors updated on the progress of her online store. Instead of sending out lengthy reports, she used Google Data Studio to create a clean, easy-to-read dashboard that visualized key metrics like website traffic, conversion rates, and revenue. The dashboard was automatically updated, giving stakeholders a real-time view of the business’s performance without overwhelming them with data. This not only saved her time but also helped build trust with her investors.
Future Trends in Data Visualization
Data visualization is continuously evolving, and staying ahead of the trends can give marketers a competitive edge. Here’s what to watch for in the coming years.

1. AI-Driven Analytics
Artificial Intelligence (AI) is making its way into data visualization, automating the process of identifying patterns and insights. Tools with AI capabilities can analyze vast amounts of data and highlight key trends without manual intervention. This allows marketers to focus on strategy rather than sifting through data. Expect to see more AI-powered features in tools like Tableau and Looker, helping marketers uncover insights they might have missed.
2. Augmented Reality (AR) Visualizations
Imagine being able to visualize your data in 3D, overlaying it onto real-world environments. Augmented Reality (AR) is set to bring this to life. Although still in its early stages, AR could soon allow marketers to interact with data in entirely new ways, providing a more immersive and intuitive experience. This could be particularly useful for presenting complex data to clients or stakeholders, making it easier to grasp the bigger picture.
3. Personalized Dashboards
As data becomes more personalized, so too will the dashboards we use to visualize it. Future tools will likely offer even more customization options, allowing marketers to tailor dashboards to specific audiences or campaigns. Whether you’re presenting to a tech-savvy team or a group of non-technical stakeholders, you’ll be able to create a dashboard that speaks directly to their needs.
4. Integration of Cross-Channel Data
The future of data visualization lies in the ability to integrate data from multiple channels seamlessly. This means marketers will be able to pull data from social media, email, web analytics, and more into a single, cohesive dashboard. Tools that excel in cross-channel integration, like Domo and Power BI, will become increasingly valuable as marketers strive for a holistic view of their efforts.
Conclusion
Data visualization is no longer a luxury—it’s a necessity for marketers who want to stay ahead of the game. By choosing the right tool, you can transform overwhelming data into clear, actionable insights that drive results. Whether you’re just starting out with Google Data Studio or diving into advanced analytics with Tableau, the key is to find a tool that fits your needs and helps you visualize your success.